
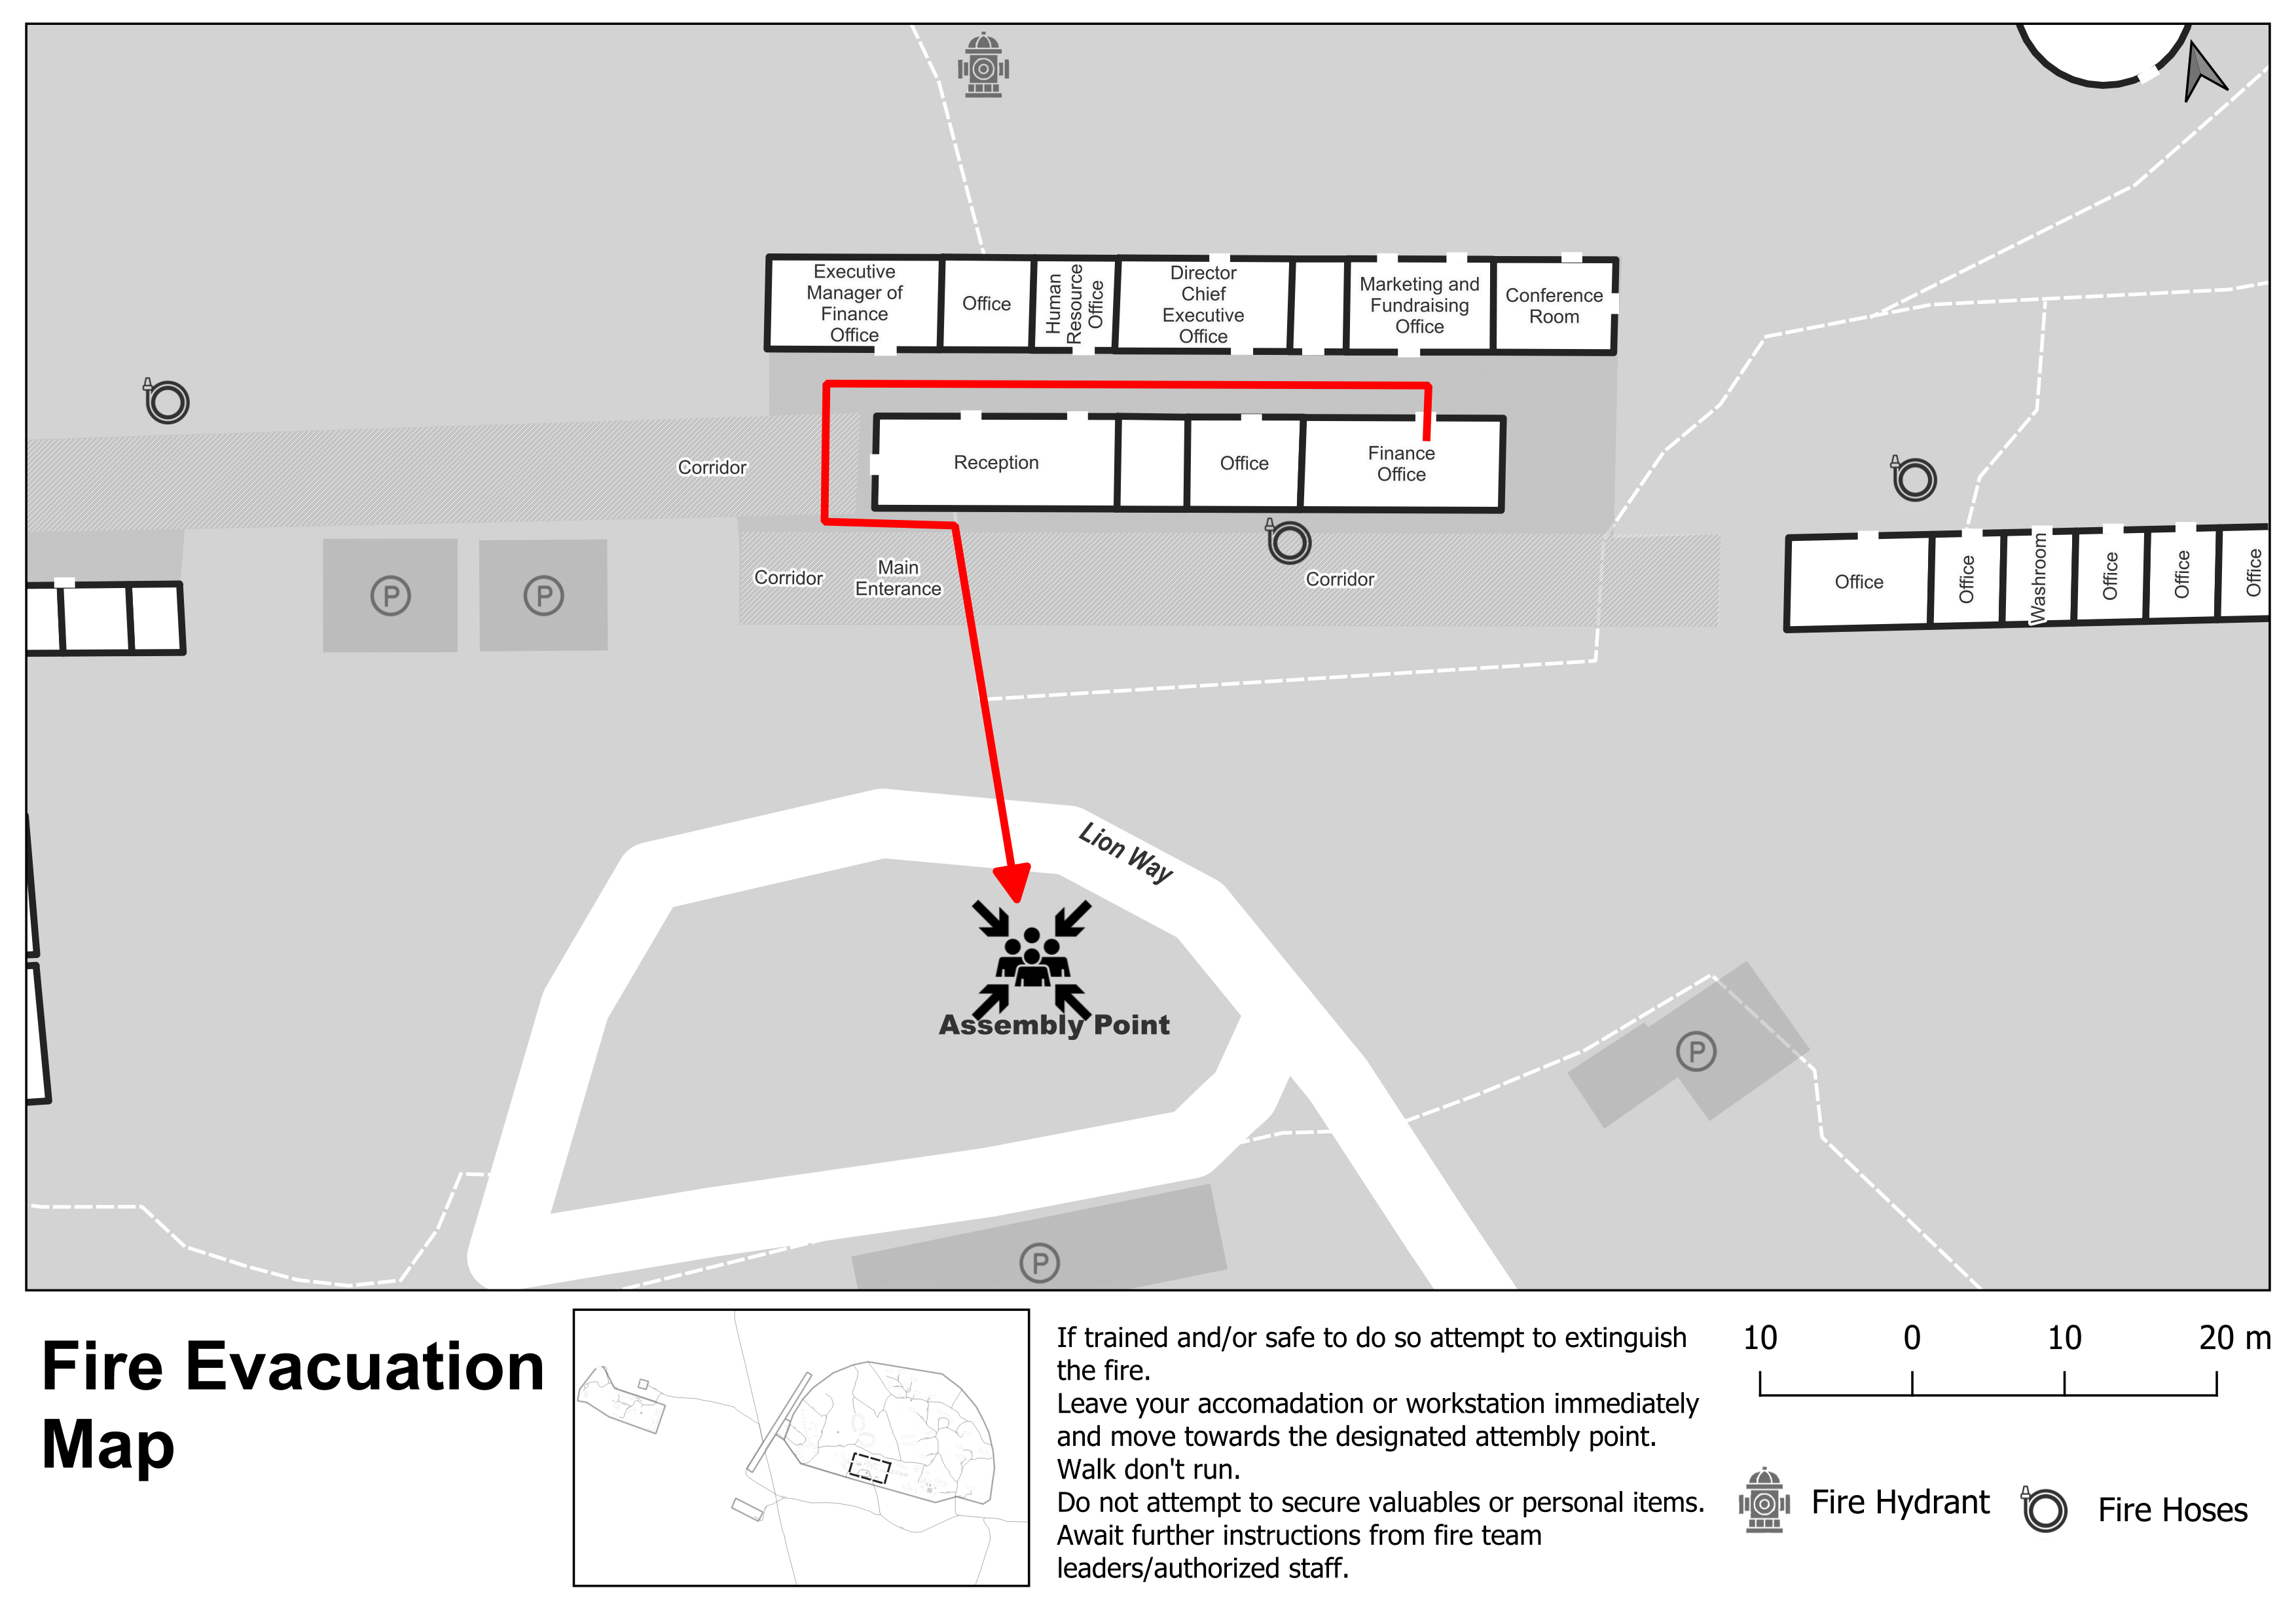
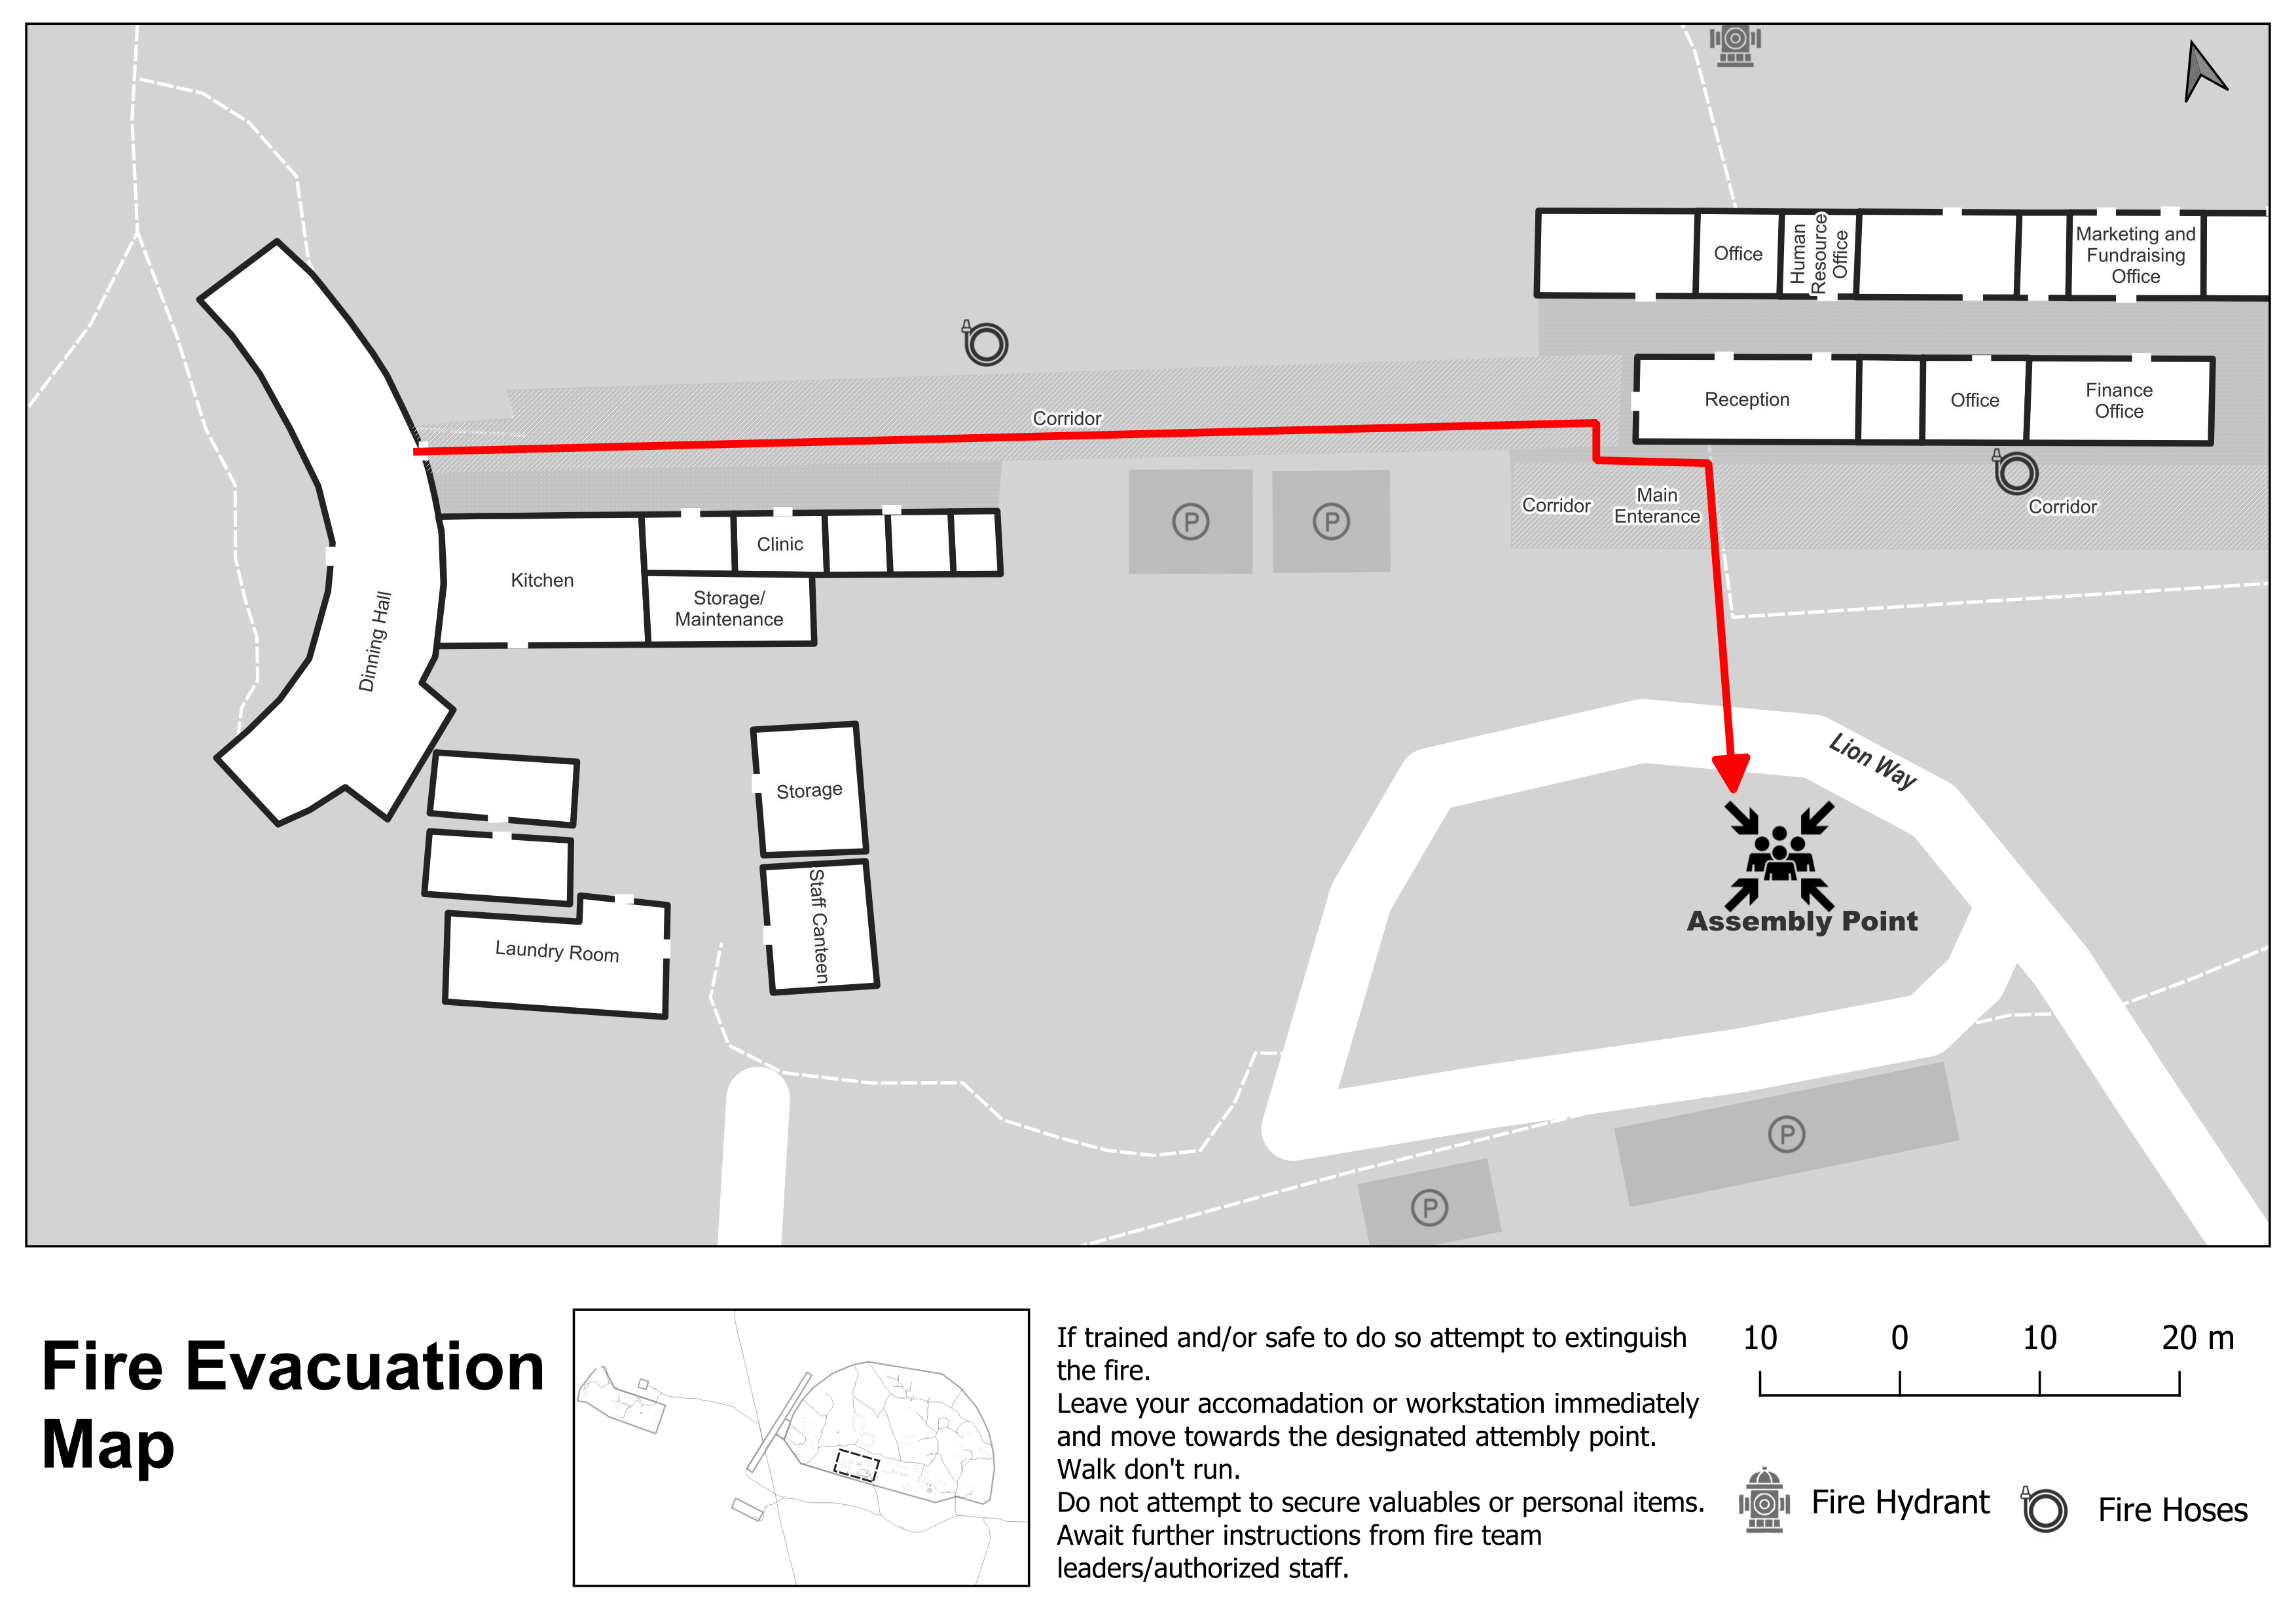
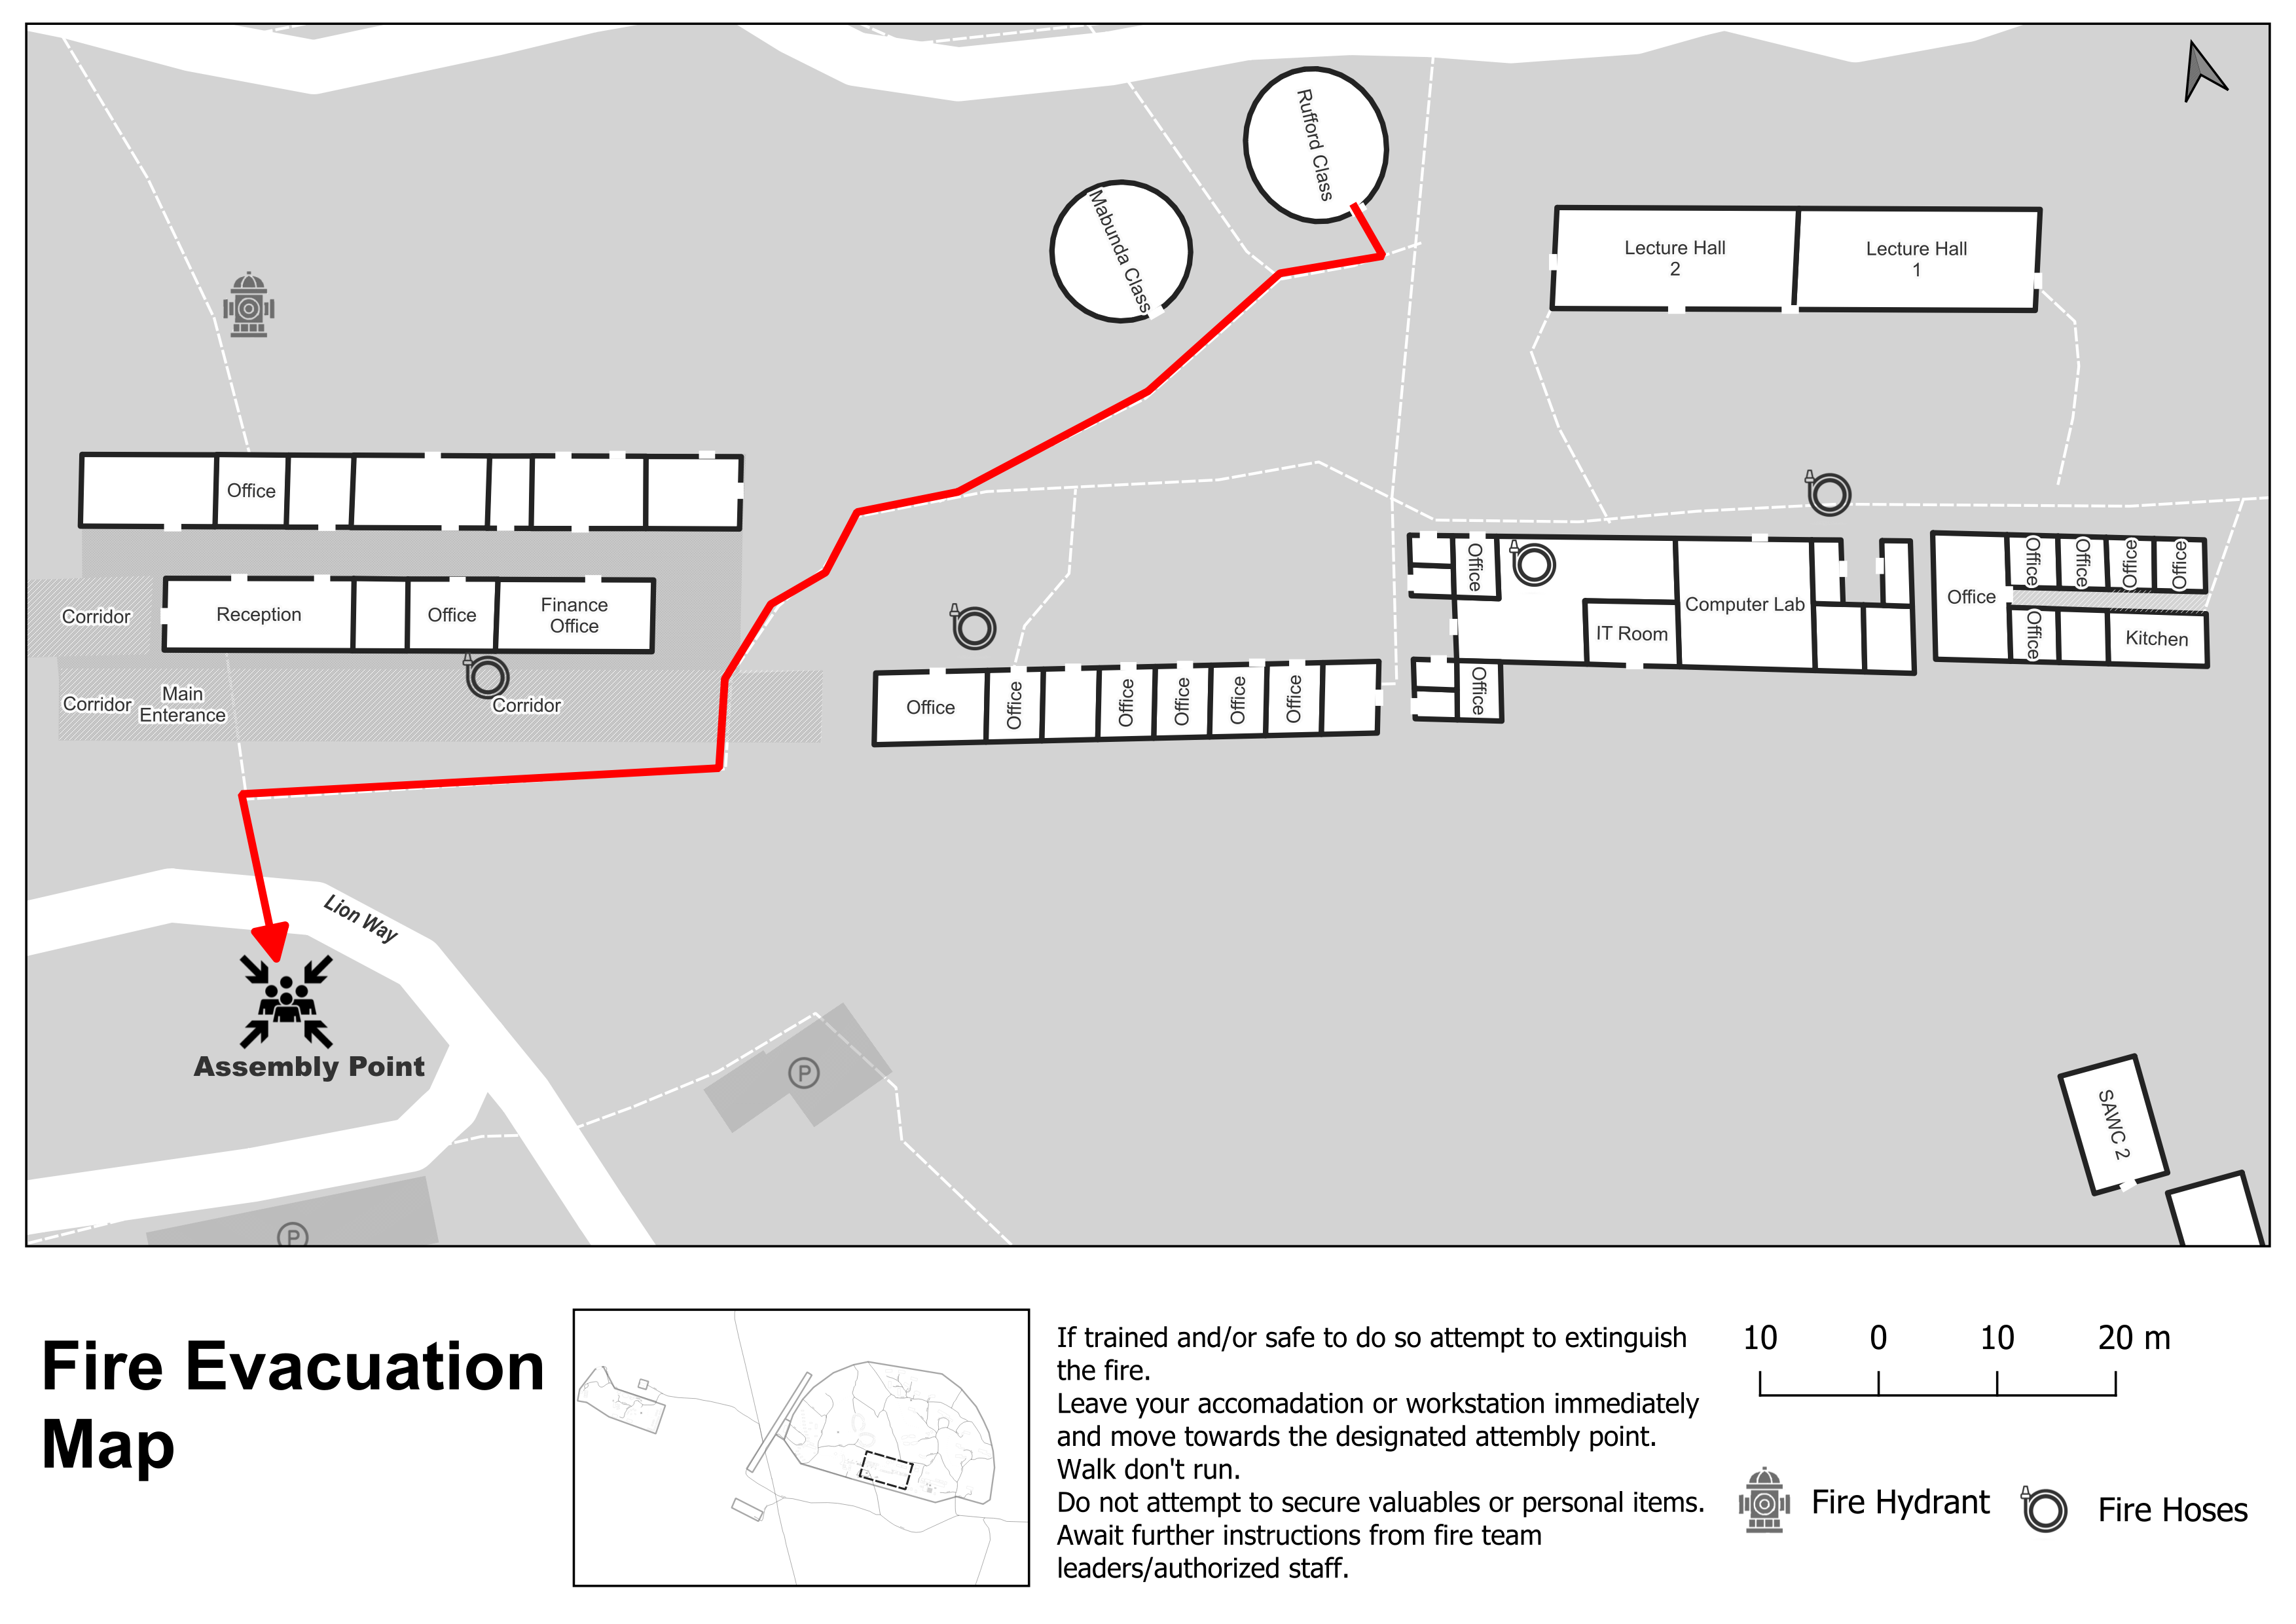
The Southern African Wildlife College requested evacuation maps to be created. These would be printed and displayed in the respective room. The symbology needed to be greyscale, as there is limited access to colour printers. The routes are the only element shown in colour to establish visual hierarchy. Using QGIS Map Atlas, nine PDFs maps were created, three of which are shown above.
Exit points needed to be created to show where someone can exit a building. Survey 123 was used to create a point layer and collect basic information about the exit point, including name and location. These were collected in the main area of the campus on site. Some were also digitized with QGIS. A field for the direction of the exit points was also added in QGIS to orient the rectangular symbology. Each door direction was either up, down, left, right, or angled down.
The fire equipment and assembly points were collected in the previous year. However, new points were added in both layers for the ranger camp area. These layers were provided by SAWC.
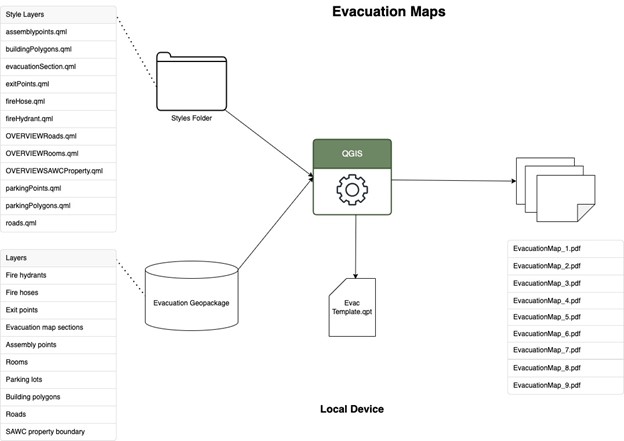
The College chose QGIS as their desktop software to create static maps. All layers were added to a QGIS project file from a Geopackage. The focus of this map is on the assembly points, fire extinguishers, and fire hoses. The rooms and roads show where the reader is in comparison to the nearest assembly point, and how the user can go to it. The building, parking, exit point, college boundary, and Kempiana boundary are used to provide context to the user on where the assembly points and rooms are located. Lastly, the evacuation map sections are a completely invisible layer that is used for the layout extent of the final product.
Creating symbology for each individual layer was time consuming. Should the map file be lost or damaged, a method to easily implement specific symbology was created. This was done through QGIS style file, which were created for each layer. These files contain symbology and labels for each layer. Colour printers are not easily accessible to the College; therefore, the maps were styled as greyscale except for the annotations. The style files contain all symbology for the layers including colour, size, labels, picture, and shape. This prevents the need for individually styling for each layer if the project file is lost.
The map layout had an overview map that shows were the main map extent is in comparison to the campus boundary. The overview map has the same layers but different colour choices to the main map, which requires the use of map themes. The main map layers were placed in a layer group, and any layer used in the overview map was copied into a separate group. Separate symbology was applied to the layers in the overview map group, which was also stored in style files. The two groups were placed into map themes, which the creator can toggle between.
The print layout brings in the map, and adds elements such as the title, supplementary text, scale bar, north arrow, legend, overview map, and optional annotations. A print layout was created in QGIS. All map elements were greyscale except the annotations, which were red. Nine maps were generated using Map Atlas, which is a series of maps that have the same map elements but a different extent. The evacuation map sections were used to define the extent.
Using the QGIS print layout, the maps PDFs were generated. Maps were exported together or separately depending on if route annotations were created in QGIS or by hand. These routes show how the user gets to the nearest assembly point from their room. When the annotations are done in QGIS, the PDFs need to be exported separately, since the routes are different depending on the room. If these routes are drawn by hand the maps can be exported all at once.