Above are static image versions of the SHEQ Management System Experience Builder and are not interactive.
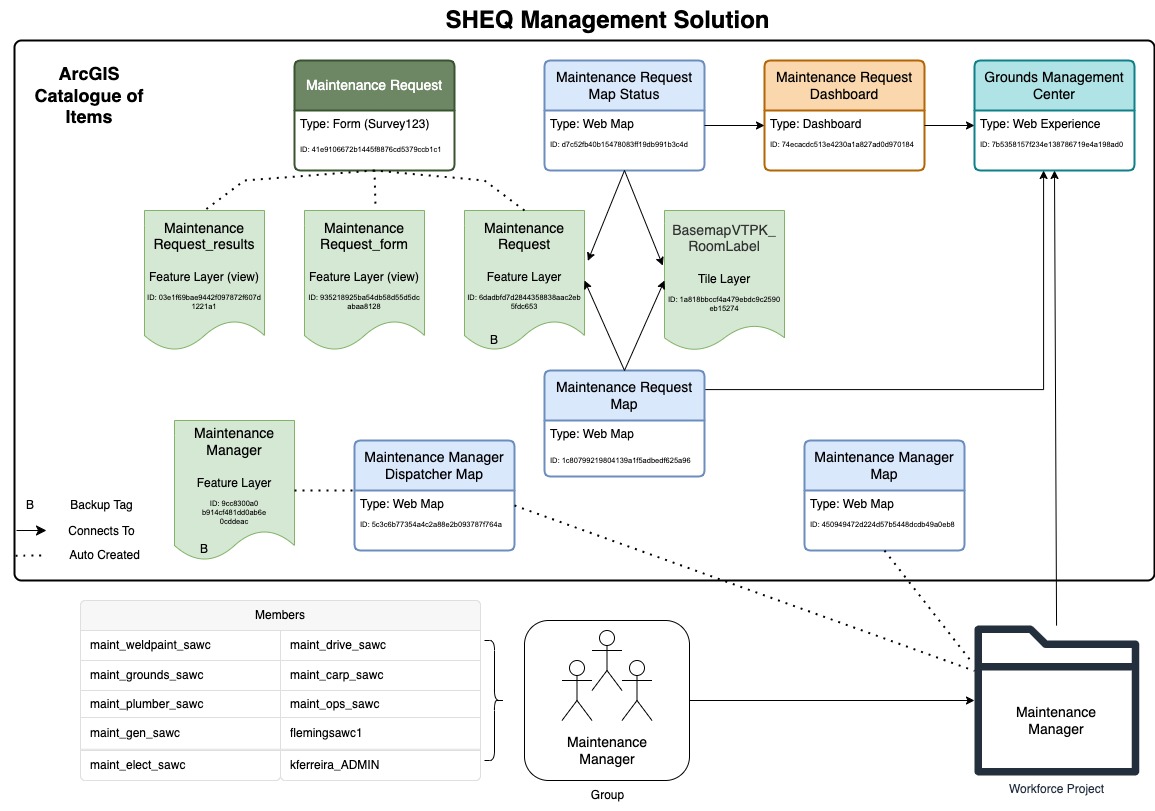
This system is designed for the maintenance team to easily manage incoming requests and delegate them to staff in the field. Additionally, it provides useful insights to the admin and manager to monitor progress and track productivity. It was created to be simple and easy to use application for the average level of technical experience. The solution is composed of multiple web applications on AGOL including Survey123, Workforce, Dashboards and Experience Builder.
While on site, the team took a drive with Thokozani (Maintenance Manager) around campus, discussion of ways in which jobs are distributed and how they are assigned. The team acquired an understanding of the different tasks around campus that are performed in preparing for environmental audits. Essential data was gathered such as: current paper format of job cards, list of specialties within the maintenance team (ie. plumber, electrician etc.) and list of current staff members.
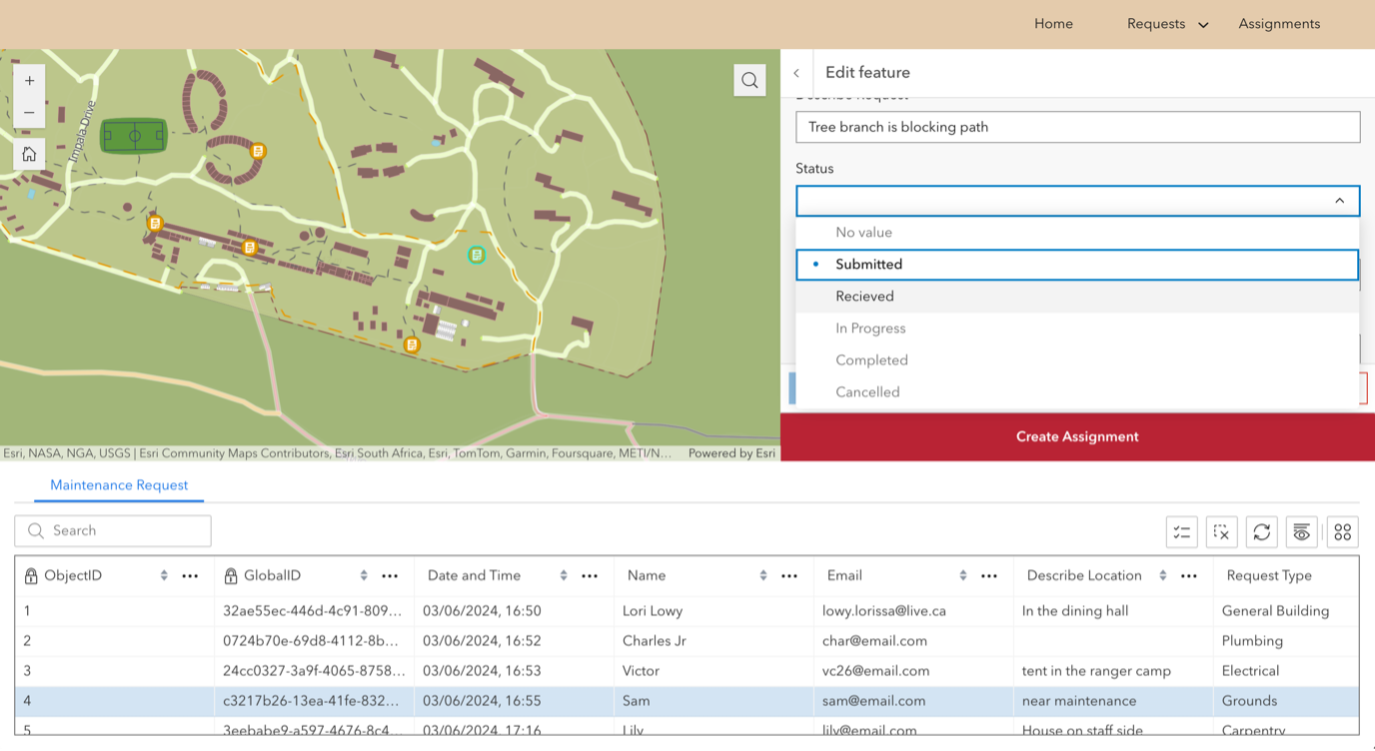
The team used the data acquired to formulate a simplistic survey that provides the maintenance team with all the essential information required to assign a task. The survey fields were created with data management in mind, setting field limits and considering how the data will be used in the following steps. Once the survey was published, three AGOL items were produced (a hosted feature layer, a hosted feature layer, view of the results, and a hosted feature layer, view of the form). The hosted feature table was then modified to add additional fields that were necessary for administrative purposes. Two domains were created, one for a new field called ‘status’, which has a default value of submitted, in addition to received, in progress, completed and cancelled. The other domain is for the list of staff members for the new field called ‘assigned_to’. Other administrative fields such as date resolved, comments and FormID were created. FormID comes from the physical job cards SAWC already uses to track work and resembles a foreign key which connects to both the feature layer and workforce assignments.
Two web maps were configured from this feature layer, both using a campus basemap VTPK with labeling turned on. The first map represents survey points symbolized as a single symbol. The second map symbolizes the survey requests by status, allowing the administrator to easily view the work that needs to be done.
A workforce project was configured to be used as the task manager for this solution. First, AGOL accounts needed to be created for the maintenance team categories. Using an administrative account on SAWC’s AGOL, the team created 8 accounts in total for each specialization within the maintenance staff and one of which was for the maintenance admin. Following that, the team added the users as field workers, so tasks can be assigned to them, and the maintenance admin as the dispatcher, the assigner of tasks. Several assignment types were created so the admin can specify what the type of task is. The campus basemap was applied to the dispatcher and worker map so that the assignment point can be visualized within the context of the area. The dispatcher map was also configured to show the feature layer of the survey points with the status of submitted or received. They disappeared after the status is changed to be in progress within the hosted feature layer.
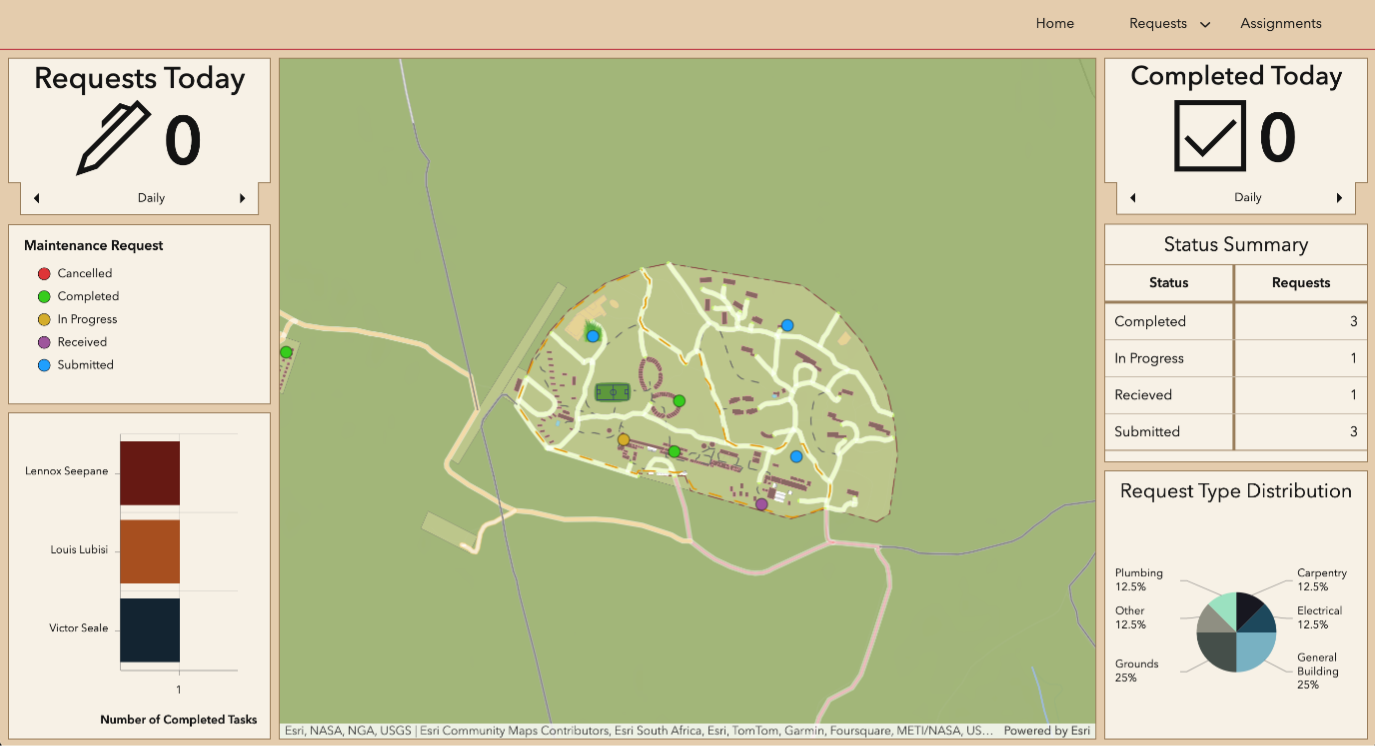
The Dashboard was configured to provide the administrator a way to monitor ongoing tasks, view field staff productivity and see the distribution of requests by type. The center of the dashboard shows the web map with the symbology relating to the status of the request. The legend for the Web Map is displayed on the side panel for easy interpretation. Two sets of indicators were configured, one set displays requests submitted today, this week and this month. The second set shows tasks completed today, this week and this month. A status summary was created by listing the count of requests by their current status. The last addition to the dashboard was a bar chart that shows number of tasks completed by staff member. .
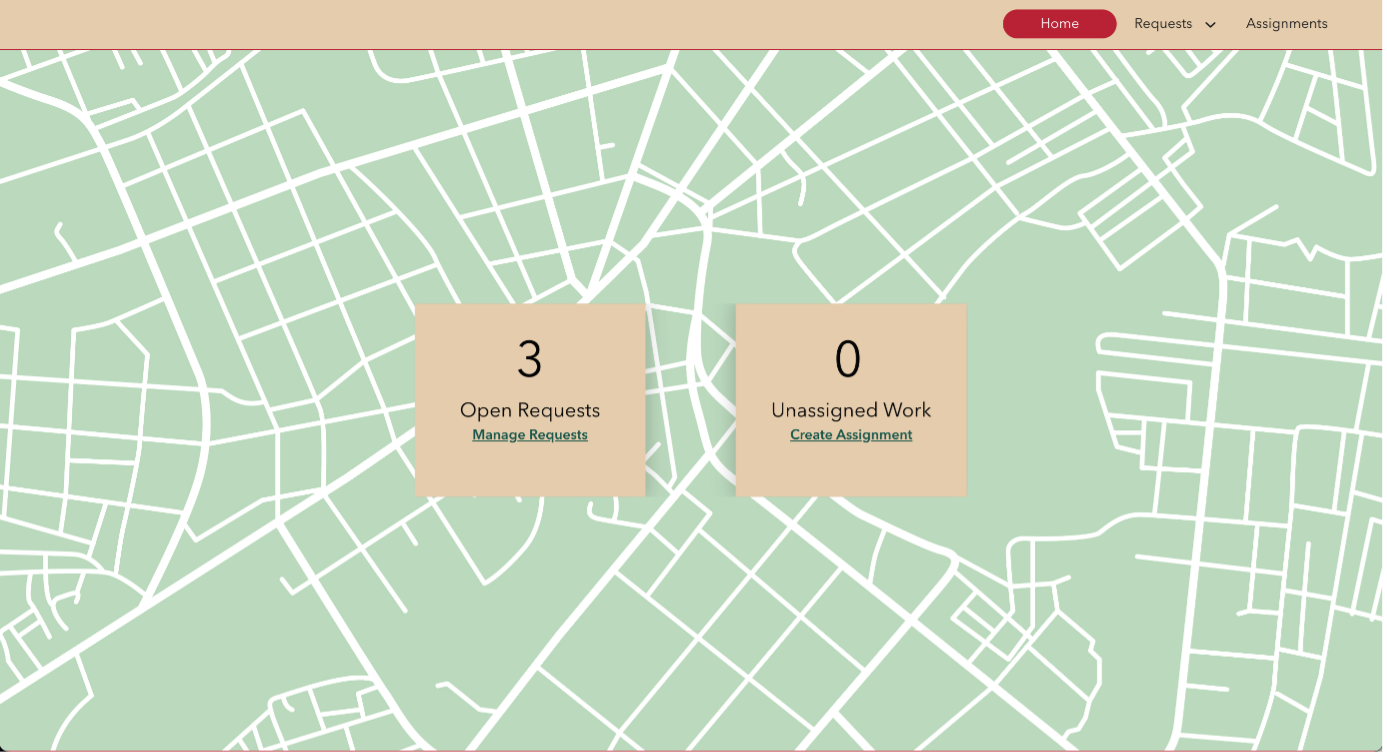
All components of the solution come together in the experience builder. 4 pages were created: Home, Manage, Monitor and Assignments. The home page is comprised of a background image and two text boxes that are linked to the data. The first text box displays the number of open requests, surveys with a status of ‘submitted’. The second box is unassigned work and connects to the workforce feature layer and indicates assignments that have been created but not assigned to a field worker.
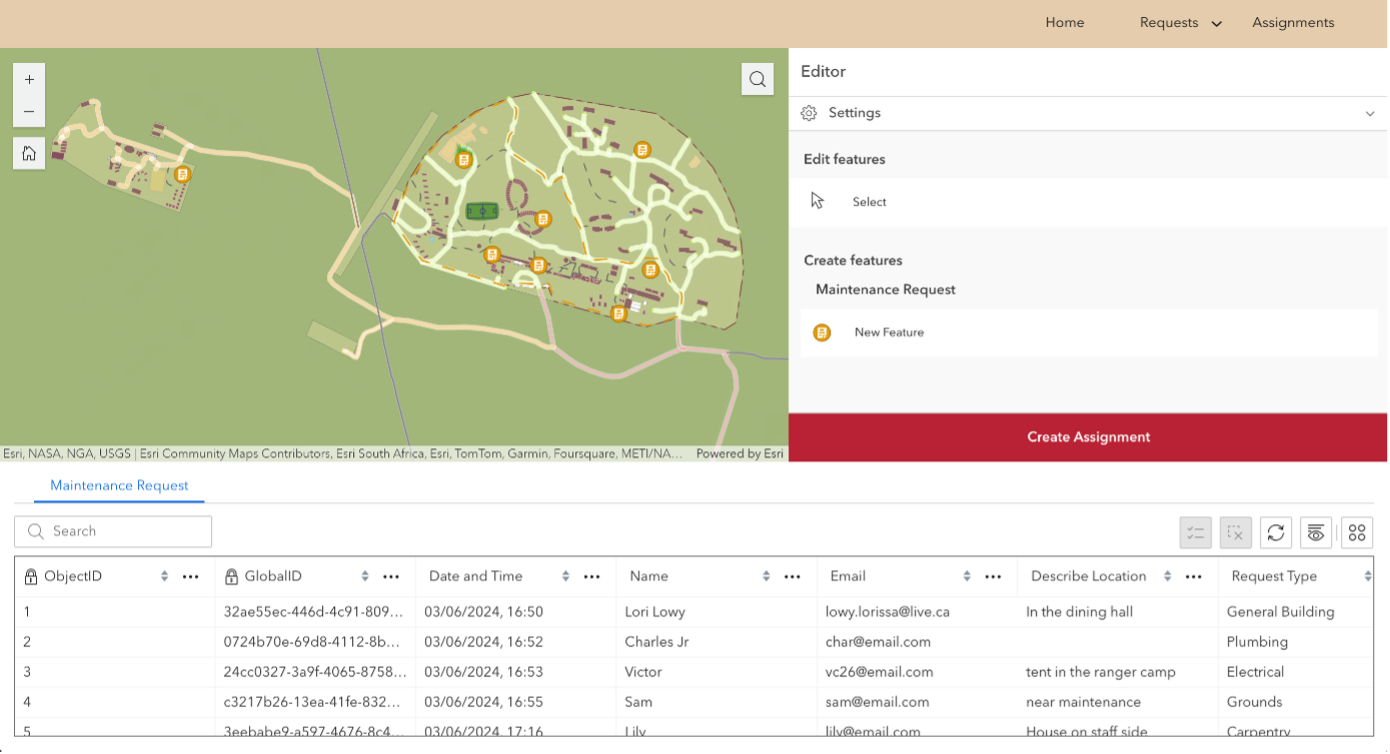
The manage page has 3 features, a map widget that connects to the Request web map, a table that connects to the Maintenance Requests feature layer and an editor widget. It was configured so that when an entry in the table is selected or a point on the map, the editor panel opens, allowing the user to edit the feature. There is also a button that links to the Assignments page.
The Monitor page uses the embed widget to place the dashboard that was created in step 5.
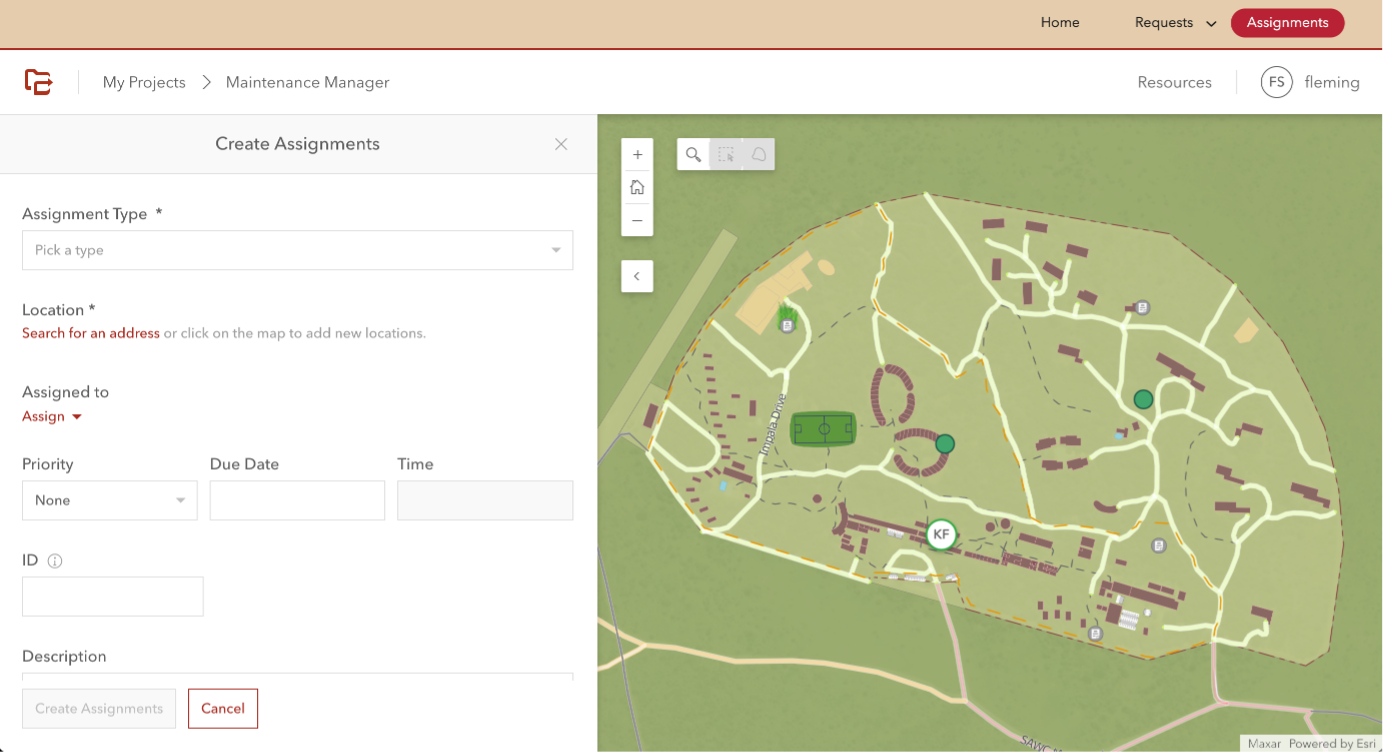
The Assignment page uses the embed widget to display the workforce project on the page that allows the user to create an assignment.
The last part of the SHEQ Management Solution was to test out the system for issues and errors. This led to further improvements in the system and helped develop the user's manual. The testing process included trying out the workflow, making mistakes and ensuring that those mistakes didn’t break the system and were easily corrected. The process for creating the user guide was to go through the intended workflow taking screenshots and document the steps in a comprehensive way.